The Network Trace widget is designed to call and interact with any geoprocessing service. The input should be a point feature or features, and the output can return polygon, polyline, or point features as results. For example, this widget can be configured to use a geoprocessing service that traces a geometric network and returns an outage area and affected assets. To learn how to configure this widget to perform an isolation trace on a geometric network, visit the Water Outage template.
Configure the Network Trace widget
This widget can be set to open automatically when
an app starts. Hover over the widget and click the Do not open this widget when
the app starts button  to change the setting to Open this widget automatically when the app starts. (For widgets that you need to add to the app first, you can turn on this option after configuring the widget.)
- Hover over the widget and click the Configure this widget button
 to open the configuration window.
Note:
If you need to add the widget to the app first, click a widget placeholder on the Widget tab. In the Choose Widget window that opens, select the widget and click OK.
- Optionally click Change widget icon and replace the default icon for this widget with your own image.
A file explorer window appears, allowing you to choose a local image file to use as the widget icon.
- Select the Set button and provide the task URL for your geoprocessing service.
Note:
The geoprocessing service requires at least one output parameter with a specified geometry type.
Configuration settings
There are three sections to consider when configuring the Network Trace widget: Project Settings, Input, and Output.
Project settings
The project settings are optional. If you configure these settings, you can define a project and save the trace inputs and input results.
Note:
The selected geoprocessing service must have a polygon as the output geometry type; otherwise, the project settings will be disabled.
The options on the Project Settings tab are as follows:
- Project polygon layer—This polygon layer must have Create, Delete, and Update editing capabilities and include a field called name (a string type field) and a field called globalid (a GlobalID type field).
- Output parameter name—The output polygon layer or layers from the task URL.
- Project point layer—This point layer must have Create, Delete, and Update editing capabilities and include a field called inputtype (a string type field) and a field called projectid (a GUID type field).
Input
The Input tab provides options for configuring the input settings for the trace.
- For each input parameter, set the type to Flag, Barrier, or Skip.
- Specify the ToolTip and symbol.
- Optionally provide text to appear on the input tab of the widget.
Output
The Output tab provides options for configuring the output settings for the trace results.
- For each output parameter, select any of the following options:
- Visible—Select the visible layers in the trace results that are checked. If Visible is not checked, the result layer will show the output parameter as unchecked in the trace result pane.
- Skippable—Allow features in this layer to be passed to the skip input parameter.
- CSV—Select the results to export to a .csv file.
- To save output parameters, select the drop-down arrow under the Save to Layer setting and select the layer.
Note:
If the project settings are not configured, the Save to Layer option is unavailable. - For each output parameter, update the symbology by selecting the corresponding symbol.
- Click the Settings button
 to update the label, ToolTip, display text, and scale for the output results.
 - Provide text to appear on the output tab of the widget.
- Click the Add Summary Items button
 .
. - Click the Input/Output parameter from the menu.
- Select the Operator parameter and Field parameter based on your desired summary text.
Note:
The count operator is based at the layer level and therefore is available for all input/output options. The sum, min, max, and mean operators are based at the field level and only show if a number field exists in the layer. - Click Add to add the summary item to the text box.
- When finished, click Cancel to close the dialog box.
- Click the Add Summary Items button
- Enable Auto zoom after trace if you want the map to zoom to the trace results.
Use the Network Trace widget
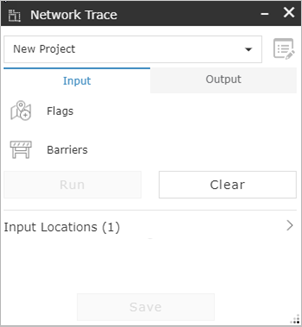
When it's configured, this widget can be used by a water utility to determine an isolation area in the event of a main break.
- Open the Network Trace widget to display the Input tab. Optionally, you can configure a custom URL to run the trace at a set location. To run the trace using the custom URL, you must set the widget to open automatically and use one of the following formats for the custom URL:
- Using the spatial reference of the map: https://<domain>/apps/webappviewer/index.html?id=<itemid>&flags=[[x,y]]&runTrace=true
- Using a different spatial reference than the map: https://<domain>/apps/webappviewer/index.html?id=<itemid>&flags=[[Lat,Long]]&wkid=<wkid>&runTrace=true
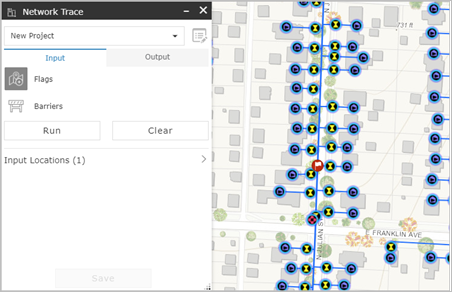
- Add a flag location and, if required, a barrier.
Note:
Press the Control key to activate snapping.
- Click Run to start the trace.

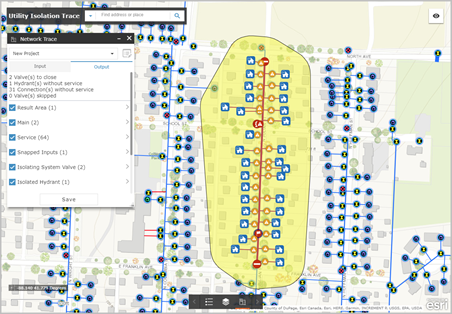
The map zooms to the extent and displays the trace results.
- View the summary and the output results.

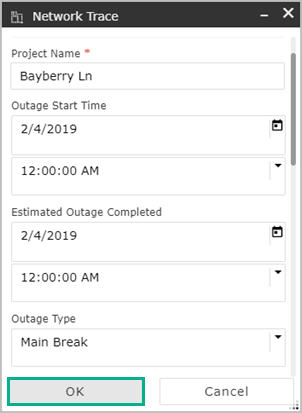
- Click Save.
Note:
Project settings must be configured to save the trace. - Provide the project name and any additional information in the project attributes pane.

- Click OK to finish saving the results.